Thursday, 25 April 2013

WEEK 15

OBJECTIVE:

  • to prepare for engineer day presentation.


ACTIVITY:

  • Analysed the last output for all type.
  • Making poster for engineer days


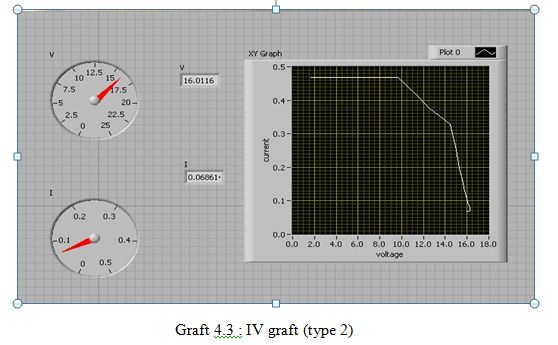
            The result from  Figure 4.2, 4.3,4,4 has been combine at Figure 4.3. Form this result can be analysed the best output will generate between the type. Blue line is result for type 1, red line is result for type 2 and green line for type 3.  The maximum power in type 1 is 4.6W. The maximum power in type 2 is 4.37V and 5.6W in type 3. There is no much difference between type 1 and type 2 because the difference temperature cold side and hot side is not much between type 1 and 2.  Thermoelectric principle is when the difference temperature is increase, the higher output will generate. Type 3 has most large max power between other type because of the large difference temperature between inside and outside building temperature.

In this week need to do demonstration and presentation about development and performance analysis PV-TE energy harvester prototype on building wall by using labVIEW.

ENGINEER'S DAY

Saturday, 20 April 2013

WEEK 14

OBJECTIVE:
To measure the value  of IV characteristic using labVIEW.

ACTIVITY:

  • Continue to construct the labView block diagram.
  • Continue solve the problem with the circuit and labVIEW and DAQcar
  •  To measure and determine the value of voltage and current. 
  • To measure the power output produce.
  •  To generate IV graph using labVIEW


Figure above are shown how the constructions of the block diagram. From the figure show that there is a loop to place DAQ assist, multiplier, numeric and meter to measure voltage and current. At voltage part, the value must multiply by 2 because the voltage at the hardware has been dividing into two because of voltage divider.  It compulsory to multiply the voltage value. The result will be show at the graph and numeric indicator.
            At the current part, the value must multiply by 6 because of using 6 resistor in this project. The value of the resistor is 82Ω. . Connect all the output from solar panel and thermoelectric module to the circuit and connect the voltage and current wire to DAQ card. Run the labView software in order to get IV graft. Increase the value of variable resistor from 0Ω to 1kΩ.


The power produced by the cell in Watts can be easily calculated along the I-V sweep by the equation P=IV.   the value of power is 4.6W

The value  power of the type 2   is 4.37W

The value  power of the type 3   is 5.6W

From this project, the best max power generate is type 3 compare with other type due to the higher difference temperature between cold and hot side. All information and the result have been representing in the graph


Friday, 12 April 2013

WEEK 13

Objective:

  • To measure the value  of IV characteristic using labView.


Activity:

  • Continue to construct the labView block diagram.
  • Continue solve the problem with the circuit and labVIEW and DAQcard

This project will be used variable resistor to make the load increase. The value of variable resistor used is 1kΩ. from the variable resistor, can see there is a change when the value is increase. All this change will be show and discuss below.


 labVIEW block diagram

           The specification of the DAQ card (SBC-68) are provide in the laboratory is The Maximum Voltage can support by DAQ card only 10V. Need Voltage divider (VD) circuit to cut the value output value into half. The current part, DAQ card cannot measure the current directly. Also need external circuit (current divider, ID) to measure the current. By using ohm law’s, the current can be calculated when there is a voltage and resistor (V=IR). 

In conclusion, the objective of this work didn't achieve because of the IV graph cannot meet the specification. the graph show that the output in inverse output. 


Friday, 5 April 2013

WEEK 12

Objective:

  • To measure the value  of IV characteristic using labView.

Activity:

  • construct the labView block diagram.
  • connect the data acquisition( DAQ) card from Output Circuit to computer.

   In this week need to construct block diagram at labVIEW software. In the labVIEW has been place the DAQ assist, multiplier, numeric indicator and meter to measure voltage and current, and XY graph to plot XY characteristic.

      This part will testing  all the result with all type of place thermoelectric. Firstly, test and measure the output of photovoltaic and thermoelectric place inside the building with air conditioning temperature. Secondly, test and measure the output value of photovoltaic and thermoelectric place outside the building. Lastly, test and measure the output value of photovoltaic and thermoelectric place outside and inside the building. All the result (Current vs. Voltage) will display in the labVIEW using XY graph.

      The objective of this week not achieve because of the value of Voltage and current cannot be measure. the value at the labVIEW only shown the higher value of Voltage and current and didn't show the exact value in the variable resistor increase and decrease.  

Saturday, 30 March 2013

WEEK 11

ACTIVITY :
Construct and design Prototype and casing for this project.

OBJECTIVE:

  • To place the circuit inside the box.
  • To make the project more tidy.

            Using the cupboard, to make the casing for the circuit. Place circuit under the sunlight prototype. Firstly, make the cupboard into square shape. After that, closed the cupboard using sunlight prototype. Make a hole around the cupboard because the input wire can be connecting easily outside the box. 


Saturday, 23 March 2013

WEEK 10

Activity:
  • Construct and  Development circuit to combine 2 source into 1 output. 

Objective:

  • Construct the circuit by using breadboard and test the circuit 
  • Construct and design using print circuit board  (PCB). 
  • Test the circuit
  • Rectifier circuit by using diode
    Construct the circuit by using breadboard
    Design connection of the rectifier circuit
    Process of etching
    Drilling

      Construct the component at the PCB 

      Process of solder the circuit
    Full rectifier circuit 
for this week, the result for the rectifier circuit full fill the expectation  expectation.  The outputs Voltage from the PV and TE can be combine. The Value is more large when combine the two circuit.


Friday, 15 March 2013


WEEK 9

Activity:
  •   Construct the circuit to test the PV module characterisation. To investigate the electrical characteristic of PV module under varying loads.

Objective:
  • To investigate the IV curve characteristic of PV module
    Circuit for measure IV characteristic
    Connection for measure IV characteristic

Saturday, 9 March 2013

WEEK 8

 Activity:
  •   Develop the wiring  of the sunlight prototype.
Objective:

  • To make the spotlight on and support the enough photon for photovoltaic (PV).
  • Connect the positive and negative wire together. 
    240V Mains Halogen Aluminised Spotlight
    spotlight used as sunlight
Cover the wire to make sure there is no contact between each other
Tidy the wire at the playwood
Full prototypeAfter the light is turn on, the reading of PV show that the voltage is increase to 20V. The max voltage of this type of PV is 21V.  The light should be 90degree perpendicular with PV. This condition to make the PV get enough photon from the light. The Picture below show the Voltage of PV using multimeter.
V= 20V

Friday, 1 March 2013

WEEK 7

 Activity:
  Development of lamp act as sunlight 

Objective:
  • Construct the body part of the lamp project
  • Cutting the playwood 
    (a)
(b)
Figure (a) & (b) is a process of cutting the wood to make the prototype 


Process to construct the body part of the spotlight

Cover the playwood with sellotape


Prototype of light to act as sunlight


Wednesday, 20 February 2013

WEEK 6
Activity:
  •   Testing the Solar Panel

Objective:
  • To make sure this Solar Panel are functioned.
  • Measure the output value from the Solar Panel (directly without any circuit). Measure the voltage and current output produced from the Solar Panel using Multimeter.
  • Determine the maximum performance using this Solar Panel. To produce the max output,  test the Solar Panel at shining day. 
        The solar Panel will produce the different output power depending on the brightness of the light.  For this testing, not use sunlight, but change the sunlight with brightness of the lamp.Solar Panel can be operating when we expose to  brightness of the lamp and there will give the electricity output. from this testing we can analyzed that the more brightness apply at the PV, the more output value will be get. 

Thursday, 14 February 2013

WEEK 5

Activity:

  •   Testing the Thermoelectric Module 
    Objective:
  • To make sure this Thermoelectric Module are functioned.
  • Measure the output value from the Thermoelectric Module  using Multimeter.
  • Determine the maximum performance using this Thermoelectric Module.  To produce the max output,  give the largest different temperature on each side of the Thermoelectric Module.
250mV without human temperature
700mV with human temperature

While measuring  the output value produced from the thermoelectric, i'm using ice cube to get 0degree celcius and the temperature of the human body has been used. Voltage that produced are around 250mV - 700mV. Thermoelectric Module can be operating when we supply the power and there will give some different temperature of the each side of that module which means, the grater different temperature apply at the thermometer, the larger output will be produce.

Friday, 8 February 2013


WEEK 4

ACTIVITY:

  • Project Progress.
    •  Buy the project materials.


OBJECTIVE:

  • Buy the solar panel.
  • Buy thermoelectric module.


            For this week progress, the solar panel and thermoelectric module have been purchased at Jalan Pasar. Measuring equipment and tools also have been purchased.

The specification for this solar panel is:
-  Max output power: 5W
-  Vmp: 16.8V
-  Imp: 0.3A
-  Voc: 21V
-  Isc: 0.38A
-  Dimension: 254 x 294 x 25

For the thermoelectric module, this component converts the heat into electricity and the output maybe approximately around 10mV~50mV.
Photovoltaic

Thermoelectric


Friday, 1 February 2013

WEEK 3

Activity:
  • Project Progress.
    • Buy the component for two supply controller.

PRINT BOARD CIRCUIT

H-BRIDGE COMPONENT AND CAPACITOR


Objective:
  • Design circuit in the bread board.
    • Testing the circuit using the bread board.

                This week there have showed some progress which The  two supply controller circuit have been designed. Using the bread board, the simple circuit have been designed. For the next week progress, maybe the solar panel should be purchased at the market and the circuit will be tested with the solar panel.


Friday, 25 January 2013

WEEK 2

ACTIVITY
  • Find the hardware and equipment for the project.
OBJECTIVE
  • Check and get related tools for the FYP project
    • For the component and tools can get at the Jalan Pasar shop. 
    • Some material need to get at hardware shop for example wire for the lamp.
  • Planning the progress of this project carefully to get best product and result
    • The FYP progress should contains the step below:
      •   Idea and project the title.
      •   Project preparation.
      •  Concept development and testing.
      • Project development and testing.
      • Final preparation.
  • At the end of next week the equipment and tools have been buy and all the raw materials related to this project also have classified.

Monday, 14 January 2013

WEEK 1

ACTIVITY

  • Final Year Project (FYP)  Briefing I at TTL2
  • Search the component for the project
OBJECTIVE 
  • To know about the new agenda in FYPII
  • Update profile for  the website  FYP (RPS).
    • student need to update the blog at RPS website
    • change or put the latest contact number.
  • Search the need component for project from internet.
    • this project need to order photovoltaic and thermoelectric
    • thermoelectric has been order in 4 pieces.